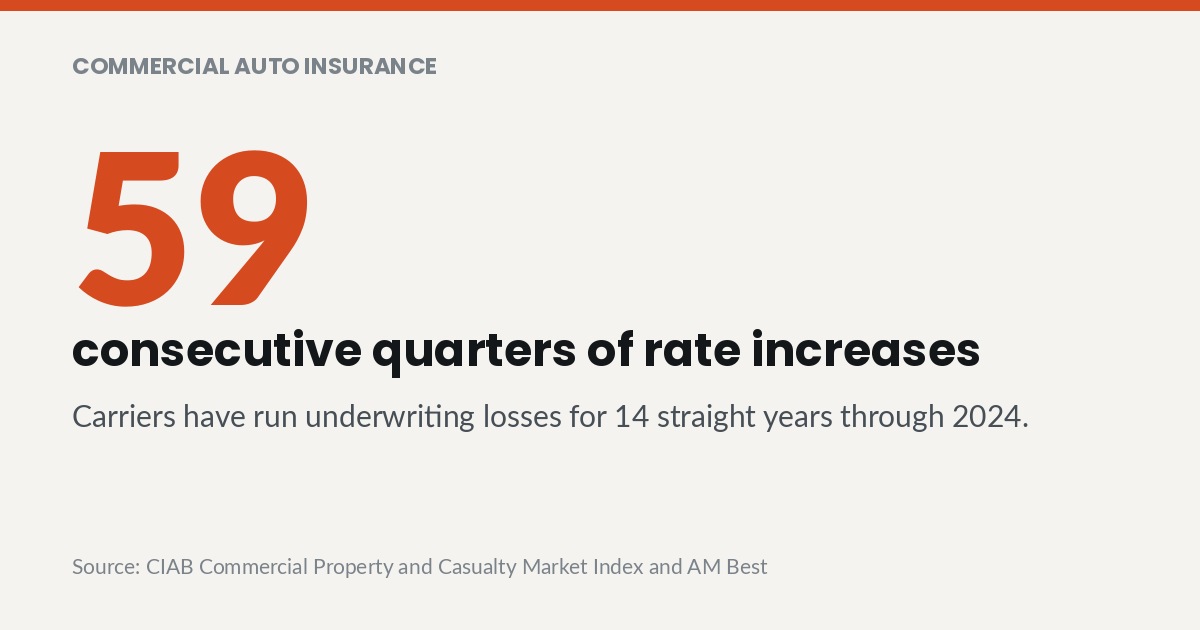
A DOT compliance consultant earns the fee in the insurance market, not the audit file. Commercial auto premiums rose 5.8 percent in Q1 2026, the highest increase of any line in the CIAB Commercial Property and Casualty Market Index. That is 59 consecutive quarters of increases since Q3 2011. Safety data is what breaks the pattern for a single fleet.
Fifteen years of increases is not a market cycle
A market cycle implies a turn that eventually arrives. Commercial auto has not produced one since the third quarter of 2011, according to the CIAB Commercial Property and Casualty Market Index. The Q1 2026 reading of 5.8 percent was the highest increase of any line in that survey.
The reason is visible on the carrier side of the ledger. AM Best records net underwriting losses in commercial auto for 14 straight years through 2024, and 15 counting the 2025 loss. Insurers raising rates for 59 consecutive quarters while still losing money on the line are not extracting rent. They are chasing a loss cost that keeps moving away from them.
That distinction matters for how a fleet plans. An operator budgeting for the market to soften is budgeting against 15 years of contrary evidence. The rational plan assumes continued pressure and works on the one variable the operator actually controls.
Severity, not frequency, is the engine
The US Chamber Institute for Legal Reform studied verdicts at the top of the distribution. Its sample covered 1,288 personal injury and wrongful death verdicts of $10 million or more between January 1 2013 and December 31 2022. Auto accident verdicts within that sample carried a median of $21.0 million and a mean of $46.4 million.
The distance between median and mean describes a tail rather than an average. Across all personal injury and wrongful death categories in the same study the median was $21.1 million and the mean $88.9 million. A small number of outcomes drags the average far above the midpoint.
That shape is what reprices an excess liability tower. Primary limits absorb the routine file without much drama. The verdicts that move an insurer's reserves land in layers most mid-market fleets did not think they needed.
Severity exposure also changes what a claim file has to look like from day one. Plaintiff counsel builds a severity case out of documents the fleet created before the crash. Maintenance records, hours of service logs and hiring files become exhibits rather than paperwork.
The one lever a motor carrier controls
An operator cannot change the litigation environment. Jury behavior, attorney advertising volume and third-party litigation funding sit outside any fleet's reach. The same holds for medical cost inflation and for the reinsurance pricing that flows into excess layers.
What the operator does control is the individual file the underwriter prices against. Rate is built from an industry loss cost adjusted for the specific account, and the adjustment is where the negotiating room lives. Fleets treating their safety record as an input to that adjustment recover part of the industry pressure.
The lever works because the underwriter has limited information about any given account. Loss runs, roadside inspection history and CSA percentiles are close to everything an insurer knows about a mid-market fleet before binding. Each of those is generated by the operator's own daily practice rather than by the market.
That also explains why the effect takes time to arrive. Loss runs cover multiple years and roadside history accumulates over a rolling window. A program started this quarter shows up in pricing two renewals out, which is why fleets waiting for a hard renewal to act are always late.
The crash data is improving and the premium is not
The exposure side of the equation is moving in the operator's favor. National Safety Council analysis of NHTSA FARS data for 2024 counted 5,218 large trucks in fatal crashes, down 3 percent from 2023. The rate was 1.58 per 100 million large-truck vehicle miles traveled.
The trend line in that series is not noise. The same NSC series ran 1.68 in 2019, 1.62 in 2020, 1.75 in 2021, 1.77 in 2022, 1.63 in 2023 and 1.58 in 2024. The rate peaked and came down, and it now sits below where it stood before the pandemic.
Frequency falling while premium rises is the clearest available proof that severity is doing the work. Underwriting math multiplies frequency by severity, and only one of those terms is cooperating. A fleet that improves its crash frequency and expects a proportional rate credit will be disappointed.
The disconnect also shapes what a rate presentation should emphasize. An operator leading with improved crash frequency is arguing on the term that is already falling market-wide. The stronger argument covers severity control, meaning documented training, post-accident procedure and the evidence that limits how a claim develops.
One exposure inside the 2024 data moved the wrong way. NHTSA data for 2024 shows alcohol-impaired large-truck drivers in fatal crashes rose to 224 from 178, an increase of 26 percent. Large trucks were the only vehicle type that increased on that measure.
That single statistic is a case theory waiting to be written. A plaintiff attorney will use it to argue that industry screening and supervision practices are failing. Fleets with documented testing programs and supervisor training answer that argument with records rather than testimony.
What an underwriter actually reads
Submissions are underwritten on loss runs, safety rating and roadside inspection history. Those three items describe a fleet more honestly than any narrative in the application. Out-of-service rates in particular give an underwriter a defensible benchmark.
Loss run presentation is where most mid-market submissions give away money. A raw export shows claim counts and reserves without explaining what changed after each one. Fleets that annotate their loss runs with the corrective action taken give the underwriter a reason to price the future rather than the past.
The FMCSA Pocket Guide, drawing on MCMIS data for calendar year 2023, reports a driver out-of-service rate of 6.4 percent and a vehicle out-of-service rate of 22.6 percent. CVSA reported an 18.1 percent vehicle out-of-service rate and a 5.9 percent driver rate across 56,178 inspections during its 2025 International Roadcheck. A fleet sitting above those benchmarks is telling the underwriter something specific about its maintenance program.
Brakes are the largest vehicle finding
CVSA recorded 5,561 brake violations in 2025, accounting for 41.1 percent of vehicle out-of-service violations. Brake defects are a preventive maintenance interval problem rather than a capital problem. A fleet that shortens its inspection cycle and documents the result changes that number within a quarter.
Hours of service leads driver findings
Hours of service was the top driver out-of-service violation in the 2025 CVSA data at 1,076 findings, or 32.4 percent. Electronic logging made those violations visible without making them disappear. Fleets that audit logs weekly and coach on the exceptions convert an underwriting liability into evidence of supervision.
CSA scores are a public document
CSA percentiles are visible to underwriters, brokers, shippers and plaintiff counsel at the same time. A fleet managing them only at renewal is managing them for the wrong audience. The score reflects roadside behavior over a rolling window, which means correction takes months and neglect compounds quietly.
Turning compliance into an underwriting asset
Most fleets treat DOT compliance as a threshold to clear. Treated that way it produces a passing score and no premium benefit. Treated as an underwriting submission it becomes the most cost-effective insurance spend available to a mid-market operator.
The mechanics of building that submission are unglamorous and cheap. A driver scorecard combining telematics events, roadside results and preventable accidents gives an underwriter a management story with numbers behind it. Dashcam footage resolves liability questions early, which matters most in exactly the severity environment the verdict data describes.
Submission quality is a separate discipline from safety performance. Two fleets with identical loss runs receive different quotes when one explains its trend and the other sends a form. Operators who want that framing built properly often bring in outside operating help. A management consulting engagement covering risk and operations tends to pay for itself within a single renewal.
Timing matters as much as the content of the file. Submissions assembled in the last week before expiration reach underwriters with no room to ask questions. A fleet that puts its package together well ahead of renewal gets a market that competes rather than a market that declines.
Structural options open up once the data is clean. Higher retentions, captive participation and group programs all require a loss history an underwriter will accept at face value. Fleets that cannot document a safety program have no access to those structures and pay guaranteed cost rates instead.
The commercial auto market has spent 59 quarters telling operators the same thing. Price follows severity, severity follows litigation, and litigation follows the documents a fleet created before anything went wrong. Operators who treat compliance records as future exhibits rather than regulatory chores are the ones whose renewals stop surprising them. That is an operating decision rather than a rate strategy.
Frequently Asked Questions
Does hiring a DOT compliance consultant actually lower insurance premiums?
Premium outcomes follow the underlying data rather than the engagement itself. A consultant who reduces out-of-service findings, clears hours of service exceptions and documents a preventive maintenance program changes what the underwriter sees at renewal. Fleets with clean roadside histories and explained loss runs receive better terms than fleets carrying the same losses with no narrative. The effect arrives over renewal cycles rather than immediately.
How long should my fleet expect commercial auto rates to keep rising?
The CIAB Commercial Property and Casualty Market Index has recorded 59 consecutive quarters of commercial auto increases since Q3 2011. AM Best records net underwriting losses on the line for 14 straight years through 2024. Rates rising while insurers still lose money indicates the pricing has not yet caught the loss cost. Planning around a soft market means planning against the entire available record.
What out-of-service rate should my fleet be targeting?
National benchmarks give the reference point for any target. The FMCSA Pocket Guide, using MCMIS data for calendar year 2023, reports a driver out-of-service rate of 6.4 percent and a vehicle rate of 22.6 percent. A fleet materially above those figures will be underwritten as a maintenance risk regardless of its loss history. The goal is less a specific number than a documented downward trend.
Are dashcams worth the cost and the driver resistance?
In a severity-driven market the value sits in liability resolution rather than in coaching. Footage that establishes fault early prevents a routine claim from developing into the kind of file the verdict data describes. The US Chamber Institute for Legal Reform found auto accident verdicts in its large-verdict sample carried a median of $21.0 million. Against that tail, camera hardware cost and internal friction are minor considerations.
Should a mid-market fleet consider a captive or a higher retention?
Those structures reward fleets whose loss data is both clean and credible. Higher retention transfers volatility back to the operator, which works only when frequency is controlled and severity is insured above it. Captive participation requires a safety program an underwriter will underwrite rather than merely tolerate. Fleets without documented processes should fix the record before changing the structure.
What should a fleet fix first if resources are limited?
Brake maintenance and hours of service auditing address the two largest categories in the CVSA data. CVSA recorded brake violations at 41.1 percent of vehicle out-of-service findings in 2025 and hours of service at 32.4 percent of driver findings. Both respond to process discipline rather than capital investment. A fleet that fixes those two areas moves its inspection profile faster than through any other single action.
No comments:
Post a Comment
Note: Only a member of this blog may post a comment.