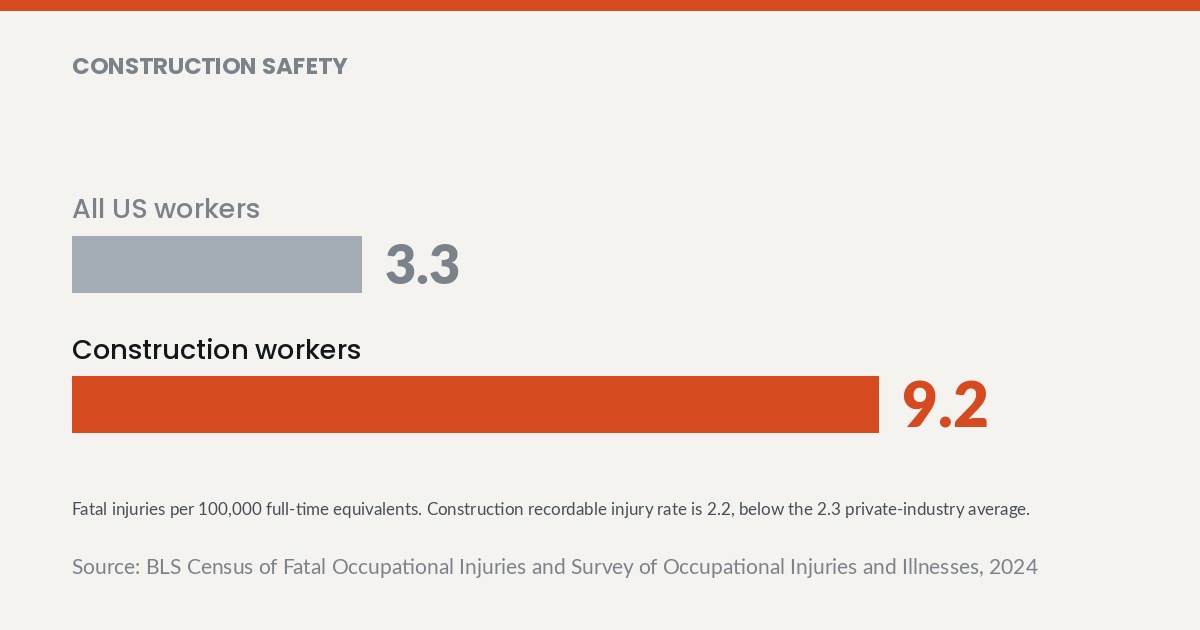
Construction workforce management fails when safety programs are graded on injury frequency. BLS data for 2024 puts the construction total recordable case rate at 2.2 per 100 full-time equivalents, below all private industry at 2.3. That same year, the construction fatal injury rate was 9.2 per 100,000 against 3.3 for all US workers.
Two Rates That Point in Opposite Directions
The BLS Survey of Occupational Injuries and Illnesses for 2024 shows construction recording fewer injuries per worker than private industry overall. The BLS Census of Fatal Occupational Injuries for the same year shows construction killing workers at nearly triple the all-industry rate. Both statements come from the same agency and the same reporting period.
Most safety programs are designed against the first number. Recordable rate and DART drive scorecards, bonus formulas, and prequalification thresholds across the industry. Those measures track how often something goes wrong rather than how badly.
Specialty trade contractors sit at 2.3 total recordable cases and 1.4 DART per 100 full-time equivalents, according to BLS. Those figures describe a workforce that gets hurt about as often as an average private-sector workforce. The fatality data describes a workforce operating in a fundamentally different hazard class.
What Actually Kills People on a Jobsite
BLS counted 1,034 construction fatal work injuries in 2024. Specialty trade contractors accounted for 606 of them. Any program that treats construction as one undifferentiated risk pool is averaging across very different exposures.
Falls Remain the Structural Problem
Falls, slips and trips caused 389 deaths in construction during 2024, or 37.6 percent of the total, according to BLS Census of Fatal Occupational Injuries Table A-9. No other event category in the construction data comes close to that share. A fall exposure that produces no recordable injury for months still carries the same lethal potential every day it exists.
Frequency-based programs handle this badly by design rather than by accident. A crew working at height without incident generates a clean recordable rate and an unchanged risk profile. The scorecard rewards the absence of consequences rather than the absence of exposure.
OSHA enforcement reflects the same pattern from the other direction. The fall protection standard 1926.501 is the most cited standard in OSHA construction data, with 6,769 citations and $44,969,484 in penalties in FY2025 according to OSHA IMIS records. Enforcement follows the fatality distribution more closely than most internal safety programs do.
That alignment is worth sitting with for a moment. The regulator and the mortality data agree on where the danger concentrates, and the industry scorecard does not. A contractor optimizing for recordable rate is optimizing against a measure that neither OSHA nor the coroner uses.
Overdose Now Outranks Electrocution
BLS recorded 90 construction worker deaths from drug and alcohol overdose in 2024, or 8.7 percent of the total. Electrocutions killed 52 construction workers that year, or 5.0 percent of the total. One of those categories has a dedicated OSHA standard, a toolbox talk library, and a decade of training material behind it.
The other sits almost entirely outside the safety function. Overdose deaths get handled by human resources, by employee assistance programs, or by nobody at all. The fatality data says that allocation of attention no longer matches the actual risk.
Construction workforce management has to absorb this shift in the risk profile. Injury history, opioid prescribing after those injuries, and irregular schedules all interact in ways that a jobsite audit cannot detect. A safety committee that never discusses substance risk is ignoring a larger killer than electricity.
The reporting structure makes this harder than it needs to be. Safety directors report incident data upward and rarely see the health plan or leave data that would flag the same population. Contractors that connect those views find the risk before it becomes a fatality line in a federal table.
The Regulator Reads Severity, Not Frequency
OSHA IMIS data for FY2025 shows specialty trade contractors carrying 23,197 citations and $92,678,478 in penalties. That represents 87.3 percent of all construction citations. Enforcement pressure concentrates in the same segment that accounts for most construction deaths.
The OSHA serious violation maximum penalty stands at $16,550, unchanged from 2025 because no 2026 inflation adjustment was issued, per an OSHA memo dated May 21 2026. A flat penalty ceiling does not mean flat exposure. Citation counts multiply, and the segment-level totals show what that multiplication produces.
Prequalification systems in construction mostly ask for recordable rate, DART, and experience modification. A contractor can present clean numbers on all three while running the exact exposures that produce the fatality statistics. Owners and general contractors accepting those numbers as sufficient are buying comfort rather than information.
The concentration figure deserves particular attention from general contractors. Specialty trades absorb the overwhelming share of both citations and construction deaths, which means selection decisions carry more weight than internal policy. A general contractor with excellent internal programs and weak subcontractor screening still owns the resulting exposure.
Insurers Already Priced the Difference
NCCI reports in its 2026 State of the Line that construction carries the lowest workers compensation claim frequency of ten industry groups and the steepest frequency decline. The same report places construction at the highest medical claim severity, rising roughly 13 percent year over year. Frequency down, severity up, in one industry, in one report.
That divergence explains why workers compensation premium behavior confuses contractors who have improved their injury counts. Experience modification responds to claim history, and severe claims dominate the calculation. A contractor can reduce incidents and still watch costs climb.
Insurers are reading the same signal the fatality data sends. Construction injuries are becoming less common and more expensive when they happen. Any program that optimizes only for the first half of that sentence will keep producing unpleasant renewal conversations.
Brokers rarely frame it this plainly for their construction clients. The frequency improvement gets celebrated in the renewal meeting because it reflects genuine effort. The severity trend then arrives as a surprise in the premium, and the contractor concludes that safety investment does not pay.
Rebuilding the Program Around Severity
The practical change is not more safety activity. It is a different unit of measurement inside the same activity. Programs that track exposure to fatal-class hazards produce different behavior than programs that track incident counts.
Count Exposures, Not Just Incidents
A leading indicator worth tracking answers how many crew-hours occurred at height, near energized equipment, in excavations, or under suspended loads. Those counts move well before anyone gets hurt. Recordable rate and DART are lagging indicators that report the past and predict very little.
Collecting exposure hours requires nothing more than a field added to the daily report. Foremen already record crew size, hours, and work performed for payroll purposes. Tagging that entry with hazard class turns existing paperwork into a forward-looking risk measure.
Toolbox talks improve when they are scheduled against measured exposure rather than a rotating topic calendar. A crew spending the week on leading edge work should hear about fall protection that week. Generic rotation guarantees that the right message arrives at the wrong time.
Jobsite audits should be weighted the same way. An inspection that scores housekeeping and personal protective equipment equally with fall protection anchorage is producing a misleading score. Weighting audit findings by fatal potential changes what supervisors chase.
Prequalify Subcontractors on the Right Variables
With 599,074 specialty trade contractor establishments recorded by BLS QCEW in Q4 2025, subcontractor selection is the most consequential decision in construction workforce management. Most prequalification forms request the metrics that correlate weakly with fatality risk. Adding questions about fall protection program specifics, competent person designation, and pre-task planning practice yields far more signal.
Safety culture shows up in answers about near-miss reporting rather than in incident totals. A subcontractor reporting many near misses and few injuries is managing exposure actively. A subcontractor reporting nothing at all is usually not measuring anything.
Firms rebuilding prequalification standards and field reporting systems at the same time run into an operating-model problem rather than a safety problem. That work sits closer to operational management consulting than to compliance, because it changes how projects get staffed and supervised.
Separate Substance Risk From Discipline
Overdose fatalities will not decline through testing policy alone. Workers who fear termination do not disclose, and the exposure stays invisible until it becomes a fatality statistic. Contractors that build confidential support pathways see disclosure rates that testing alone never produces.
The operational cost of that approach is modest compared with the exposure. The alternative is a fatality category that BLS now ranks above electrocution, managed by nobody in particular. Contractors that name an owner for it are ahead of nearly everyone in the industry.
Construction has spent decades getting genuinely better at preventing injuries, and the recordable data proves it. The fatality data proves that this improvement did not transfer to the outcomes that end careers and lives. Those two facts have coexisted for years without forcing a change in how programs are measured. A contractor who takes both numbers seriously stops asking how often people get hurt and starts asking how close the work comes to killing someone. Those questions have different answers and lead to different jobsites.
Frequently Asked Questions
Why is the construction recordable rate below average if the industry is so dangerous?
Recordable rate measures how often injuries occur, not how severe they are. BLS data for 2024 shows construction at 2.2 total recordable cases per 100 full-time equivalents against 2.3 for all private industry. The fatal injury rate tells the opposite story, at 9.2 per 100,000 against 3.3 for all US workers. The industry has improved at preventing common injuries without proportionally reducing lethal exposures.
Should my firm still track DART and recordable rate?
Both metrics remain necessary because owners, insurers, and prequalification systems require them. They should not serve as the primary measure of program effectiveness. Firms that add exposure-based leading indicators alongside the required lagging metrics get a far more accurate picture of fatal risk. The two sets of numbers answer different questions and both belong on the report.
What is the single highest-value safety investment in construction?
Fall protection consistently returns the most, based on both fatality distribution and enforcement data. BLS attributes 389 deaths, or 37.6 percent of construction fatalities in 2024, to falls, slips and trips. OSHA cites standard 1926.501 more than any other, with 6,769 citations in FY2025. Investment in anchorage planning, competent person capability, and pre-task review addresses the largest identified killer directly.
How should overdose risk be handled on a jobsite?
BLS recorded 90 construction overdose deaths in 2024, which exceeded the 52 electrocution deaths that year. Effective responses combine confidential support access, supervisor training on impairment recognition, and injury management practices that reduce prolonged opioid exposure. Punitive-only approaches drive the behavior underground and eliminate the chance to intervene. The category needs an owner inside the organization rather than a policy paragraph.
Why did workers compensation costs rise even though injuries fell?
NCCI reports in its 2026 State of the Line that construction has the lowest claim frequency and steepest frequency decline of ten industry groups. The same report places construction at the highest medical claim severity, rising roughly 13 percent year over year. Fewer claims that cost more can produce a higher total than more claims that cost less. Experience modification reflects claim cost, so severity dominates the calculation.
What should subcontractor prequalification actually ask for?
Standard forms collect recordable rate, DART, and experience modification, all of which correlate weakly with fatality exposure. Stronger prequalification adds questions about competent person designation, fall protection program specifics, pre-task planning practice, and near-miss reporting volume. A subcontractor reporting many near misses and few injuries is usually managing exposure well. With 599,074 specialty trade contractor establishments in the BLS QCEW count for Q4 2025, selection quality drives program outcomes more than any internal policy.
No comments:
Post a Comment
Note: Only a member of this blog may post a comment.