Tuesday, May 26, 2026

Construction Is Safer Than Average and Far More Lethal. Both Are True

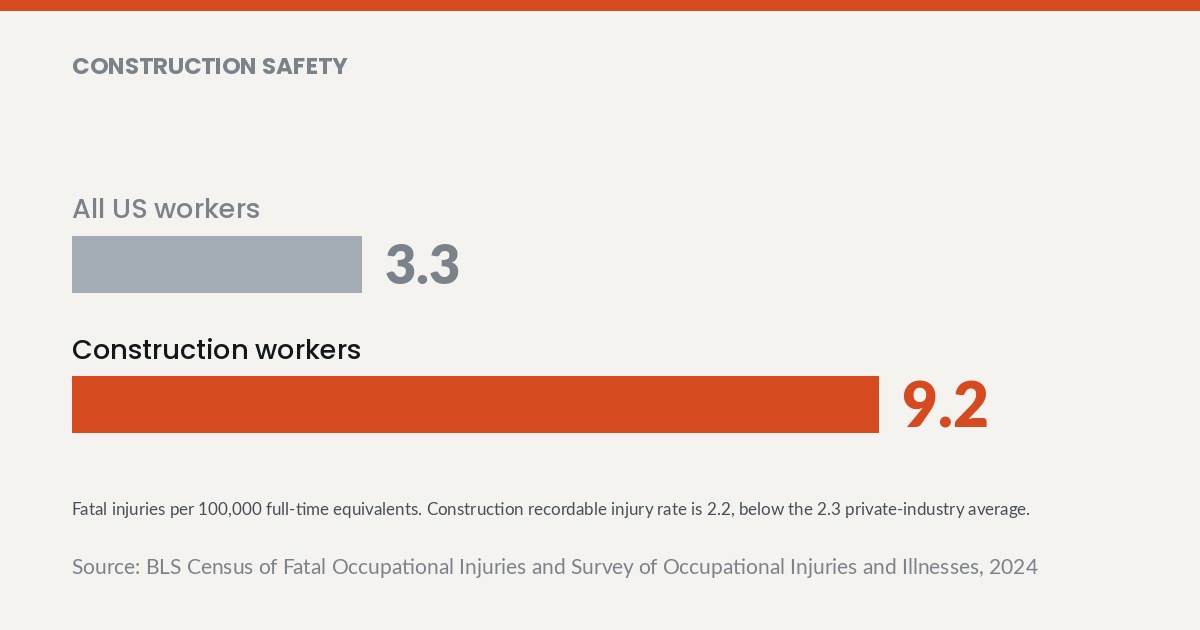
Construction safety: All US workers 3.3, Construction workers 9.2. BLS Census of Fatal Occupational Injuries and Survey of Occupational Injuries and Illnesses, 2024

Construction workforce management fails when safety programs are graded on injury frequency. BLS data for 2024 puts the construction total recordable case rate at 2.2 per 100 full-time equivalents, below all private industry at 2.3. That same year, the construction fatal injury rate was 9.2 per 100,000 against 3.3 for all US workers.

Two Rates That Point in Opposite Directions

The BLS Survey of Occupational Injuries and Illnesses for 2024 shows construction recording fewer injuries per worker than private industry overall. The BLS Census of Fatal Occupational Injuries for the same year shows construction killing workers at nearly triple the all-industry rate. Both statements come from the same agency and the same reporting period.

Most safety programs are designed against the first number. Recordable rate and DART drive scorecards, bonus formulas, and prequalification thresholds across the industry. Those measures track how often something goes wrong rather than how badly.

Specialty trade contractors sit at 2.3 total recordable cases and 1.4 DART per 100 full-time equivalents, according to BLS. Those figures describe a workforce that gets hurt about as often as an average private-sector workforce. The fatality data describes a workforce operating in a fundamentally different hazard class.

What Actually Kills People on a Jobsite

BLS counted 1,034 construction fatal work injuries in 2024. Specialty trade contractors accounted for 606 of them. Any program that treats construction as one undifferentiated risk pool is averaging across very different exposures.

Falls Remain the Structural Problem

Falls, slips and trips caused 389 deaths in construction during 2024, or 37.6 percent of the total, according to BLS Census of Fatal Occupational Injuries Table A-9. No other event category in the construction data comes close to that share. A fall exposure that produces no recordable injury for months still carries the same lethal potential every day it exists.

Frequency-based programs handle this badly by design rather than by accident. A crew working at height without incident generates a clean recordable rate and an unchanged risk profile. The scorecard rewards the absence of consequences rather than the absence of exposure.

OSHA enforcement reflects the same pattern from the other direction. The fall protection standard 1926.501 is the most cited standard in OSHA construction data, with 6,769 citations and $44,969,484 in penalties in FY2025 according to OSHA IMIS records. Enforcement follows the fatality distribution more closely than most internal safety programs do.

That alignment is worth sitting with for a moment. The regulator and the mortality data agree on where the danger concentrates, and the industry scorecard does not. A contractor optimizing for recordable rate is optimizing against a measure that neither OSHA nor the coroner uses.

Overdose Now Outranks Electrocution

BLS recorded 90 construction worker deaths from drug and alcohol overdose in 2024, or 8.7 percent of the total. Electrocutions killed 52 construction workers that year, or 5.0 percent of the total. One of those categories has a dedicated OSHA standard, a toolbox talk library, and a decade of training material behind it.

The other sits almost entirely outside the safety function. Overdose deaths get handled by human resources, by employee assistance programs, or by nobody at all. The fatality data says that allocation of attention no longer matches the actual risk.

Construction workforce management has to absorb this shift in the risk profile. Injury history, opioid prescribing after those injuries, and irregular schedules all interact in ways that a jobsite audit cannot detect. A safety committee that never discusses substance risk is ignoring a larger killer than electricity.

The reporting structure makes this harder than it needs to be. Safety directors report incident data upward and rarely see the health plan or leave data that would flag the same population. Contractors that connect those views find the risk before it becomes a fatality line in a federal table.

The Regulator Reads Severity, Not Frequency

OSHA IMIS data for FY2025 shows specialty trade contractors carrying 23,197 citations and $92,678,478 in penalties. That represents 87.3 percent of all construction citations. Enforcement pressure concentrates in the same segment that accounts for most construction deaths.

The OSHA serious violation maximum penalty stands at $16,550, unchanged from 2025 because no 2026 inflation adjustment was issued, per an OSHA memo dated May 21 2026. A flat penalty ceiling does not mean flat exposure. Citation counts multiply, and the segment-level totals show what that multiplication produces.

Prequalification systems in construction mostly ask for recordable rate, DART, and experience modification. A contractor can present clean numbers on all three while running the exact exposures that produce the fatality statistics. Owners and general contractors accepting those numbers as sufficient are buying comfort rather than information.

The concentration figure deserves particular attention from general contractors. Specialty trades absorb the overwhelming share of both citations and construction deaths, which means selection decisions carry more weight than internal policy. A general contractor with excellent internal programs and weak subcontractor screening still owns the resulting exposure.

Insurers Already Priced the Difference

NCCI reports in its 2026 State of the Line that construction carries the lowest workers compensation claim frequency of ten industry groups and the steepest frequency decline. The same report places construction at the highest medical claim severity, rising roughly 13 percent year over year. Frequency down, severity up, in one industry, in one report.

That divergence explains why workers compensation premium behavior confuses contractors who have improved their injury counts. Experience modification responds to claim history, and severe claims dominate the calculation. A contractor can reduce incidents and still watch costs climb.

Insurers are reading the same signal the fatality data sends. Construction injuries are becoming less common and more expensive when they happen. Any program that optimizes only for the first half of that sentence will keep producing unpleasant renewal conversations.

Brokers rarely frame it this plainly for their construction clients. The frequency improvement gets celebrated in the renewal meeting because it reflects genuine effort. The severity trend then arrives as a surprise in the premium, and the contractor concludes that safety investment does not pay.

Rebuilding the Program Around Severity

The practical change is not more safety activity. It is a different unit of measurement inside the same activity. Programs that track exposure to fatal-class hazards produce different behavior than programs that track incident counts.

Count Exposures, Not Just Incidents

A leading indicator worth tracking answers how many crew-hours occurred at height, near energized equipment, in excavations, or under suspended loads. Those counts move well before anyone gets hurt. Recordable rate and DART are lagging indicators that report the past and predict very little.

Collecting exposure hours requires nothing more than a field added to the daily report. Foremen already record crew size, hours, and work performed for payroll purposes. Tagging that entry with hazard class turns existing paperwork into a forward-looking risk measure.

Toolbox talks improve when they are scheduled against measured exposure rather than a rotating topic calendar. A crew spending the week on leading edge work should hear about fall protection that week. Generic rotation guarantees that the right message arrives at the wrong time.

Jobsite audits should be weighted the same way. An inspection that scores housekeeping and personal protective equipment equally with fall protection anchorage is producing a misleading score. Weighting audit findings by fatal potential changes what supervisors chase.

Prequalify Subcontractors on the Right Variables

With 599,074 specialty trade contractor establishments recorded by BLS QCEW in Q4 2025, subcontractor selection is the most consequential decision in construction workforce management. Most prequalification forms request the metrics that correlate weakly with fatality risk. Adding questions about fall protection program specifics, competent person designation, and pre-task planning practice yields far more signal.

Safety culture shows up in answers about near-miss reporting rather than in incident totals. A subcontractor reporting many near misses and few injuries is managing exposure actively. A subcontractor reporting nothing at all is usually not measuring anything.

Firms rebuilding prequalification standards and field reporting systems at the same time run into an operating-model problem rather than a safety problem. That work sits closer to operational management consulting than to compliance, because it changes how projects get staffed and supervised.

Separate Substance Risk From Discipline

Overdose fatalities will not decline through testing policy alone. Workers who fear termination do not disclose, and the exposure stays invisible until it becomes a fatality statistic. Contractors that build confidential support pathways see disclosure rates that testing alone never produces.

The operational cost of that approach is modest compared with the exposure. The alternative is a fatality category that BLS now ranks above electrocution, managed by nobody in particular. Contractors that name an owner for it are ahead of nearly everyone in the industry.

Construction has spent decades getting genuinely better at preventing injuries, and the recordable data proves it. The fatality data proves that this improvement did not transfer to the outcomes that end careers and lives. Those two facts have coexisted for years without forcing a change in how programs are measured. A contractor who takes both numbers seriously stops asking how often people get hurt and starts asking how close the work comes to killing someone. Those questions have different answers and lead to different jobsites.

Frequently Asked Questions

Why is the construction recordable rate below average if the industry is so dangerous?
Recordable rate measures how often injuries occur, not how severe they are. BLS data for 2024 shows construction at 2.2 total recordable cases per 100 full-time equivalents against 2.3 for all private industry. The fatal injury rate tells the opposite story, at 9.2 per 100,000 against 3.3 for all US workers. The industry has improved at preventing common injuries without proportionally reducing lethal exposures.

Should my firm still track DART and recordable rate?
Both metrics remain necessary because owners, insurers, and prequalification systems require them. They should not serve as the primary measure of program effectiveness. Firms that add exposure-based leading indicators alongside the required lagging metrics get a far more accurate picture of fatal risk. The two sets of numbers answer different questions and both belong on the report.

What is the single highest-value safety investment in construction?
Fall protection consistently returns the most, based on both fatality distribution and enforcement data. BLS attributes 389 deaths, or 37.6 percent of construction fatalities in 2024, to falls, slips and trips. OSHA cites standard 1926.501 more than any other, with 6,769 citations in FY2025. Investment in anchorage planning, competent person capability, and pre-task review addresses the largest identified killer directly.

How should overdose risk be handled on a jobsite?
BLS recorded 90 construction overdose deaths in 2024, which exceeded the 52 electrocution deaths that year. Effective responses combine confidential support access, supervisor training on impairment recognition, and injury management practices that reduce prolonged opioid exposure. Punitive-only approaches drive the behavior underground and eliminate the chance to intervene. The category needs an owner inside the organization rather than a policy paragraph.

Why did workers compensation costs rise even though injuries fell?
NCCI reports in its 2026 State of the Line that construction has the lowest claim frequency and steepest frequency decline of ten industry groups. The same report places construction at the highest medical claim severity, rising roughly 13 percent year over year. Fewer claims that cost more can produce a higher total than more claims that cost less. Experience modification reflects claim cost, so severity dominates the calculation.

What should subcontractor prequalification actually ask for?
Standard forms collect recordable rate, DART, and experience modification, all of which correlate weakly with fatality exposure. Stronger prequalification adds questions about competent person designation, fall protection program specifics, pre-task planning practice, and near-miss reporting volume. A subcontractor reporting many near misses and few injuries is usually managing exposure well. With 599,074 specialty trade contractor establishments in the BLS QCEW count for Q4 2025, selection quality drives program outcomes more than any internal policy.
Tuesday, January 20, 2026

Four Industries Are Losing Their Owner-Operators at the Same Time

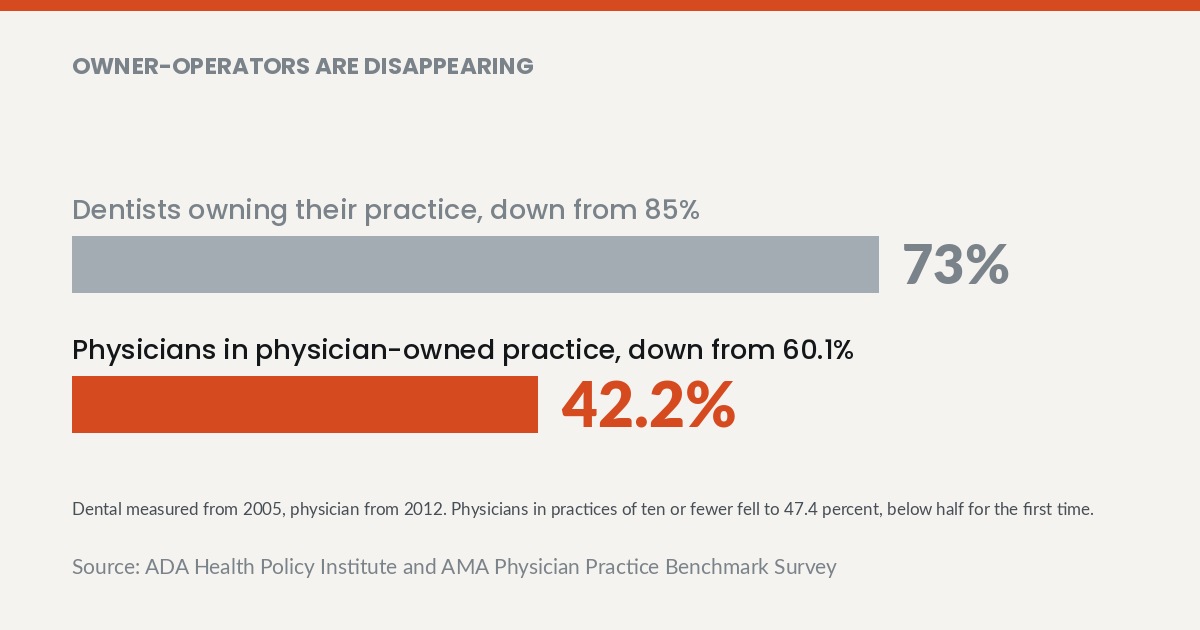
Owner-operators are disappearing: Dentists owning their practice, down from 85% 73%, Physicians in physician-owned practice, down from 60.1% 42.2%. ADA Health Policy Institute and AMA Physician Practice Benchmark Survey

A fractional COO supplies senior operating leadership part-time to companies too small to employ one full-time. Demand for that role is concentrated where owner-operators are exiting. Physicians in wholly physician-owned practices fell to 42.2 percent from 60.1 percent in 2012, according to the American Medical Association. Acquirers bring a management layer. Independents have to build one.

The same curve in five industries at once

Consolidation stories are normally told one profession at a time. Dental gets a trade press narrative about dental service organizations. Medicine gets a policy debate about hospital employment. Law gets a merger tally. Each account treats its own industry as the special case.

The data does not support that framing. Ownership is contracting on similar timelines in dental, medical, legal, automotive and construction, and the reporting bodies have no connection to each other. Five separate measurement systems are describing the same movement.

Dental

The ADA Health Policy Institute reports that dental practice ownership fell from 85 percent in 2005 to 73 percent. Affiliation moved in the other direction over a much shorter window. DSO affiliation doubled from 7.2 percent in 2015 to 16.1 percent of all dentists as of 2024.

The generational split is the sharper figure. ADA HPI found that 31 percent of dentists fewer than five years out of school are DSO affiliated. The population that would normally buy retiring owners out is choosing employment instead.

Medicine

The AMA Physician Practice Benchmark Survey for 2024, based on 5,000 physicians with a 43 percent response rate, tracks the same slope. Physicians in wholly physician-owned practices fell to 42.2 percent from 60.1 percent in 2012. Physicians holding an ownership stake fell to 35.4 percent from 53.2 percent.

Scale moved with ownership. Physicians in practices of ten or fewer fell to 47.4 percent, below half for the first time, from 61.4 percent in 2012. Solo practice fell to 11.9 percent from 18.4 percent over the same period.

Law, automotive and construction

Legal consolidation now happens at the small end. Fairfax Associates reported for 2025 that 76 percent of law firm mergers involved a firm of five to twenty lawyers, up from 69 percent in each of the prior two years. The activity is no longer about large firms combining.

Automotive shows the same compression among small owners. NADA Data for 2025 puts dealership owners operating one to five stores at 90.5 percent, down from 94.4 percent in 2016. Group ownership is absorbing single-point and small-group operators.

Construction lacks a comparable published series, which is why it is usually left out of these discussions. The pattern in specialty trade contracting is nonetheless familiar to anyone working in the sector. Aging owners, no internal successor with the capital to buy, and acquirers assembling regional platforms out of mechanical, electrical and roofing firms.

What makes the grouping notable is the independence of the measurements. Dentists are counted by a dental association, physicians by a medical association, lawyers by a legal consultancy and dealers by a trade body. No shared methodology or definition connects them.

What acquirers are actually buying

The obvious explanation is that owners are tired and buyers have capital. That is true and insufficient. Sellers are explicit about what they get in exchange, and the top answer is not relief.

The AMA found that 70.8 percent of practices that sold cited the ability to negotiate higher payment rates as a reason. Payer negotiating position is a function of size. An owner-operator cannot manufacture it internally at any level of effort.

Private equity participation is more recent than the headlines imply. The AMA reports 6.5 percent of physicians in private equity owned practices, up from roughly 4.5 percent in both 2020 and 2022. The recency shows in the acquisition dates, with 38.3 percent of private equity owned practices acquired after 2019 against 10.0 percent of hospital-owned practices.

A platform acquisition followed by add-on transactions is the standard structure. The buyer purchases one anchor firm, installs a management services organization, then acquires smaller practices that plug into the shared back office. The valuation multiple paid on the platform exceeds what add-ons receive, which is why the earnout terms differ so sharply between the two.

The cause is not industry specific

Nothing about dental economics resembles dealership economics. Payer mix, capital intensity, licensing and customer behavior have almost nothing in common across these five sectors. A common outcome across uncommon industries points to a cause that sits above all of them.

That cause is the collapse of the owner-operator management model. In a small professional firm, the owner is the entire management layer. The same person handles billing oversight, hiring, vendor contracts, compliance, marketing, technology decisions and scheduling, on top of practicing the profession.

The administrative content of that job has grown steadily. Payer requirements, employment regulation, cybersecurity obligations, software stacks and consumer expectations all expanded. The number of hours an owner can work did not.

Succession compounds the squeeze. When the next generation prefers employment, as the dental affiliation figures for early-career dentists show, the internal buyer disappears. An owner who cannot sell inside the firm sells outside it, and the outside buyer is a consolidator.

The management layer is the transferable part

Look closely at what an acquirer installs after closing and the list is unremarkable. Centralized revenue cycle and billing. Payer or vendor contract negotiation handled by specialists. Standardized hiring, onboarding and compensation structures. Group purchasing. Shared marketing. Compliance and reporting run once for many locations.

None of that is clinical, legal or technical work. It is operations. The professional service delivered to the customer is frequently unchanged after an acquisition, and in many cases it is delivered by the same people in the same building.

The acquirer is monetizing the gap between what a small firm produces and what professional management would let it produce. Spreading fixed administrative cost across more locations is real scale economics. Better contract terms, better purchasing and lower cost per transaction are the returns.

Capital access is the second half of the equation and it is genuinely one-sided. Consolidators fund equipment, technology and location expansion from a balance sheet an individual owner cannot match. That advantage is real, though it applies to growth ambition rather than to daily operating performance.

That framing produces an uncomfortable question for owners who do not want to sell. If most of the value created by consolidation comes from a management layer rather than from the transaction itself, the layer is separable from the sale.

Building the layer without selling the firm

A firm that keeps its independence still has to answer the operating problem that made selling attractive. The answer is a management capability the owner does not personally supply. Full-time senior operations hires are usually unaffordable and frequently underemployed at small-firm scale.

Part-time senior leadership is the direct substitute. Owners in this position often engage a fractional COO to install the systems an acquirer would install, then step back to a lighter cadence once the operating rhythm holds. The work is sequencing, measurement and role definition rather than a permanent seat.

Structural options exist alongside the leadership question. Independent practice associations, clinically integrated networks and management services organizations formed among independents provide shared services without an equity sale. Group purchasing arrangements deliver a portion of the cost benefit that a roll-up captures.

None of these fully replicate the rate negotiation advantage that 70.8 percent of selling practices cited. Honest advice acknowledges that. Scale genuinely produces contract terms that independents cannot match, and no operating improvement closes that particular gap entirely.

What operating improvement does close is everything else. Cost per transaction, staff productivity, cash collection speed and owner time are all controllable at any size. A firm that fixes those items has narrowed the gap to the single component that requires scale.

When selling is the correct decision

Consolidation is not a failure state and treating it as one produces bad decisions. An owner within a few years of retirement, without an internal successor and without appetite for a multi-year operational rebuild, should probably sell. Perpetuation planning that starts too late leaves no other option worth taking.

The decision worth scrutinizing is the one made by an owner with a decade or more of working life remaining. Selling to escape administrative burden trades a permanent ownership position for temporary relief. The administrative burden was solvable. The ownership stake is not recoverable.

Owners choosing that path deserve a clear accounting of what they are exchanging. Independence has an operational price and the price is a management layer. Firms that pay it directly keep the equity.

The sequencing matters as much as the decision. A firm with documented processes, clean reporting and a functioning management structure negotiates from strength if it later chooses to sell. Building the layer improves both outcomes rather than committing the owner to only one of them.

Five industries with nothing in common are losing owner-operators at the same time, and the shared explanation is that running a small firm now requires management capacity the owner cannot personally supply. Acquirers noticed first and built a business model around it. The response available to independents is the same capability on different terms, and the firms that build it will find they were never actually choosing between selling and struggling.

Frequently Asked Questions

What does a fractional COO actually do in a small professional firm?
The role installs the operating systems that an owner has been running informally. That typically covers revenue cycle oversight, hiring and onboarding structure, vendor and contract management, reporting cadence and clear role definitions across the team. The engagement is defined by scope and outcome rather than by hours in a chair. Most arrangements taper as internal staff take ownership of the systems that were built.

Is consolidation actually accelerating or is this normal industry cycling?
Independent sources across unrelated industries point the same direction. The ADA Health Policy Institute records dental practice ownership falling from 85 percent in 2005 to 73 percent, and the AMA records physicians in wholly physician-owned practices falling to 42.2 percent from 60.1 percent in 2012. NADA Data for 2025 shows dealership owners operating one to five stores dropping to 90.5 percent from 94.4 percent in 2016. Cyclical movement does not usually align this closely across sectors with unrelated economics.

Should my firm sell now or build management capability?
Time horizon is the deciding variable. An owner near retirement with no internal successor gains little from a multi-year operational rebuild and should evaluate offers seriously. An owner with a long runway is trading a permanent asset for relief that a management layer would also deliver. The comparison worth running is the cost of that capability against the value of the ownership stake being surrendered.

Why do practices say they sold if they were not in financial trouble?
Distress is not the leading motive in the survey data. The AMA found 70.8 percent of practices that sold cited the ability to negotiate higher payment rates as a reason. Contracting position scales with size in ways that operational excellence alone does not overcome. Owners frequently sell from a position of stability because the ceiling on independent negotiating position is structural.

Can independents get scale benefits without giving up equity?
Partially, and the qualifier matters. Independent practice associations, clinically integrated networks, group purchasing arrangements and independent-owned management services organizations deliver shared administrative cost and some purchasing advantage. These structures do not fully match the payer contracting position of a large consolidated platform. Firms should pursue them for cost and capability while being realistic about the rate ceiling.

How does this affect younger professionals entering the field?
Entry patterns have already shifted toward employment. The ADA Health Policy Institute found in 2024 that 31 percent of dentists fewer than five years out of school are DSO affiliated. That removes the traditional buyer for retiring owners and accelerates outside acquisition. Firms wanting an internal succession path need to make ownership attractive well before the owner is ready to exit.

Tuesday, March 18, 2025

Business Consulting Models


 Originally posted at: https://kamyarshah.com/wp-content/uploads/2024/11/Business-Consulting-Models.jpg

Understanding the Marketing Mix for Business Success


Originally posted at: https://kamyarshah.com/wp-content/uploads/2024/11/Understanding-the-Marketing-Mix.jpg

Sales operation management


 Originally posted at https://kamyarshah.com/wp-content/uploads/2024/11/Sales-Operation-Management.jpg

Monday, December 30, 2024

Transforming Underperforming Sales Teams: Strategies for Success

Underperforming sales teams can hinder business growth, but with the right strategies, they can be revitalized to achieve exceptional results. From structured training to data-driven decision-making, this post outlines actionable steps to transform sales performance and foster team success.

1. Performance Improvement Statistics
Structured training has proven to yield significant results, with companies reporting a 20% increase in sales performance within six months. Effective training and talent management are critical to unlocking a team’s potential and driving consistent success.

2. The Cost of High Turnover
High turnover is costly, with organizations incurring expenses exceeding 200% of an employee’s salary due to hiring and training costs. Reducing turnover through robust team support enhances productivity and preserves valuable resources.

3. Impact of Coaching on Sales Performance
Regular coaching sessions are a game-changer, increasing win rates by 28%. Ongoing development and personalized support improve individual performance and strengthen the team’s overall capabilities.

4. Data-Driven Decisions in Sales
Leveraging data analytics in sales enables organizations to make swift, informed decisions. Teams utilizing data are five times more likely to optimize their strategies, ensuring better alignment with market demands and customer needs.

5. Engagement and Revenue Growth
Engaged sales teams perform at three times higher levels, directly influencing revenue growth and overall business success. Building a culture of engagement through recognition, collaboration, and incentives drives motivation and loyalty.

Conclusion:
Transforming underperforming sales teams requires targeted training, effective coaching, data-driven insights, and a commitment to fostering engagement. By implementing these strategies, businesses can unlock their teams’ full potential and achieve sustainable growth.


Originally posted at https://www.linkedin.com/posts/interim-chief-operating-officer_transforming-underperforming-sales-teams-activity-7278760636304527360-dO0y


Upselling Strategies for Sustainable Growth

 Upselling is a powerful way to increase revenue while creating added value for customers. Businesses can drive growth and build stronger relationships by focusing on strategies that prioritize sustainability, personalization, and customer experience. Here’s a breakdown of effective upselling strategies designed for sustainable growth.

1. Understanding Upselling
Upselling isn’t just about boosting sales—it’s about enhancing the customer experience by offering products or services that complement their original purchase. This approach creates mutual value, fostering loyalty and trust.

2. Crafting Value-Driven Offers
Personalization is key to effective upselling. Businesses can increase acceptance rates and satisfaction by identifying customer needs and tailoring offers to align with their preferences. Value-driven offers ensure that upselling feels natural and beneficial to the customer.

3. Integrating Sustainability
Incorporating eco-friendly practices into your upselling strategy appeals to environmentally conscious consumers while enhancing your brand’s reputation. From promoting sustainable products to emphasizing your company’s green initiatives, integrating sustainability can set you apart in a competitive market.

4. Enhancing Customer Experience
A seamless customer experience across all channels fosters trust and loyalty. Streamlined interactions, personalized communication, and responsive support create a positive impression, encouraging repeat purchases and upselling opportunities.

Conclusion:
Sustainable growth through upselling requires balancing revenue growth and delivering exceptional value to customers. By focusing on these strategies, businesses can enhance customer satisfaction, strengthen relationships, and achieve long-term success.


Originally posted at: https://www.linkedin.com/feed/update/urn:li:activity:7278759945133592576

Sales Consulting Strategies for Consistent Revenue Growth

 Consistency is the cornerstone of sustainable revenue growth. In sales, achieving predictable and steady results requires a strategic approach. This post dives into four essential strategies that enable businesses to unlock consistent revenue growth and drive long-term success.

1. Importance of Consistency
Consistency transforms sporadic results into predictable success. By maintaining a steady approach to sales operations, businesses can create a solid foundation for ongoing revenue growth. A strategic focus on consistency ensures that efforts align with broader business goals, fostering sustainability.

2. Building Scalable Processes
Scalable processes are the backbone of predictable growth. Implementing repeatable and adaptable systems allows businesses to streamline operations and ensure efficiency. These processes create a framework for teams, enabling long-term success without overwhelming resources.

3. Aligning Strategies with Customer Needs
Customer-centric strategies are essential for building lasting relationships. By aligning sales approaches with customer expectations, businesses foster trust and satisfaction. This improves service quality and boosts retention rates, leading to excellent revenue stability.

4. Optimizing Team Performance
A high-performing team drives consistent growth. Leveraging data-driven coaching methods empowers leaders to tailor training to individual and team needs. Analytics provide insights into performance gaps, helping to refine skills and improve sales capabilities.

Conclusion:
Sustainable revenue growth is achieved through strategic consistency, efficient processes, customer alignment, and a focus on team optimization. By implementing these strategies, businesses can transform their sales operations into a reliable engine for growth.


Originally posted at https://www.linkedin.com/posts/world-consulting-group_sales-consulting-strategies-to-drive-consistent-activity-7278762642071031808-p4vs

Unlocking Strategic Revenue Growth for Car Dealerships

 Scaling revenue in car dealerships demands a strategic approach tailored to the industry's unique dynamics. Dealerships can achieve significant growth by focusing on key aspects like operational efficiency, high-profit opportunities, customer-centric strategies, and leveraging data analytics. This post outlines a framework to help car dealerships effectively scale revenue from $1.5M to $3M.

1. Introduction to the Framework
Car dealerships can harness tailored strategies to achieve revenue growth. This framework focuses on scaling revenue efficiently while addressing common operational and sales challenges.

2. Identifying High-Profit Opportunities
Pinpointing high-profit opportunities is crucial for sustained growth. Analyze your dealership’s offerings to focus on the most profitable vehicles or services, catering to market demands and maximizing returns.

3. Enhancing Operational Efficiency
Streamlining operations is essential to reduce overhead costs and boost profitability. From inventory management to staff workflows, optimizing processes ensures smoother operations and better resource utilization.

4. Customer-Centric Sales Strategies
Loyalty starts with understanding customer needs. Develop sales strategies that cater to these needs, providing personalized experiences that boost sales and foster long-term customer relationships.

5. Leveraging Data Analytics
Data-driven decisions create a competitive edge. Use data analytics tools to identify trends, forecast demand, and improve decision-making processes to drive strategic advantages in a highly competitive market.

Conclusion:
Achieving revenue growth in car dealerships isn’t just about selling more cars—it’s about refining every aspect of the business. From operational efficiency to personalized sales strategies, this framework offers a roadmap for dealerships to scale effectively.


Originally posted at https://www.linkedin.com/posts/fractional-interim-remote-coo-cmo_strategic-revenue-growth-framework-for-car-activity-7278758941948272642-rQWb

Psychological Strategies for Effective Upselling

Upselling is more than just a sales tactic—it's an art that combines understanding human psychology with strategic thinking. By leveraging insights into customer behavior, businesses can drive higher sales, enhance customer satisfaction, and build lasting relationships. In this post, we’ll explore five powerful psychological strategies to make your upselling efforts more effective and impactful.

1. Understanding Customer Psychology
Successful upselling starts with understanding how customers think and feel. Dive into their motivations, preferences, and pain points. By creating an emotional connection, you can align your offers with what truly matters to them.

2. Building Trust
Customers are more likely to say “yes” when they trust you. Focus on their needs, listen actively, and offer suggestions that genuinely add value. Building trust isn’t about pushing products; it’s about making customers feel understood and appreciated.

3. Leveraging Social Proof
Nothing boosts confidence in a purchase like social proof. Testimonials, reviews, and showcasing other customers’ positive experiences create a sense of security. Add a layer of exclusivity—"limited-time offers" or "exclusive deals"—to nudge customers toward quicker decisions.

4. Creating Irresistible Offers
The art of creating offers lies in how they are presented. Use techniques like anchoring (offering a high-priced option first to make the second option seem more attractive) or bundling products to show added value. Customers who perceive they’re getting more for their money are more inclined to buy.

5. Tailoring Strategies to Preferences
One-size-fits-all doesn’t work in upselling. Analyze your customers’ profiles, preferences, and past purchases. By tailoring recommendations to individual needs, you boost conversions and enhance satisfaction and loyalty.

Conclusion:
Upselling isn’t just about increasing sales—it’s about delivering value and creating a better customer experience. By using psychological insights and strategies, you can build trust, enhance satisfaction, and foster long-term relationships.


Originally published at https://www.linkedin.com/posts/kamyarshah_psychological-strategies-for-effective-upselling-activity-7278759408178757632-yvGL
